skip to main | skip to sidebar

Map Analysis

Tuesday, June 17, 2008

Bivariate Choropleth map


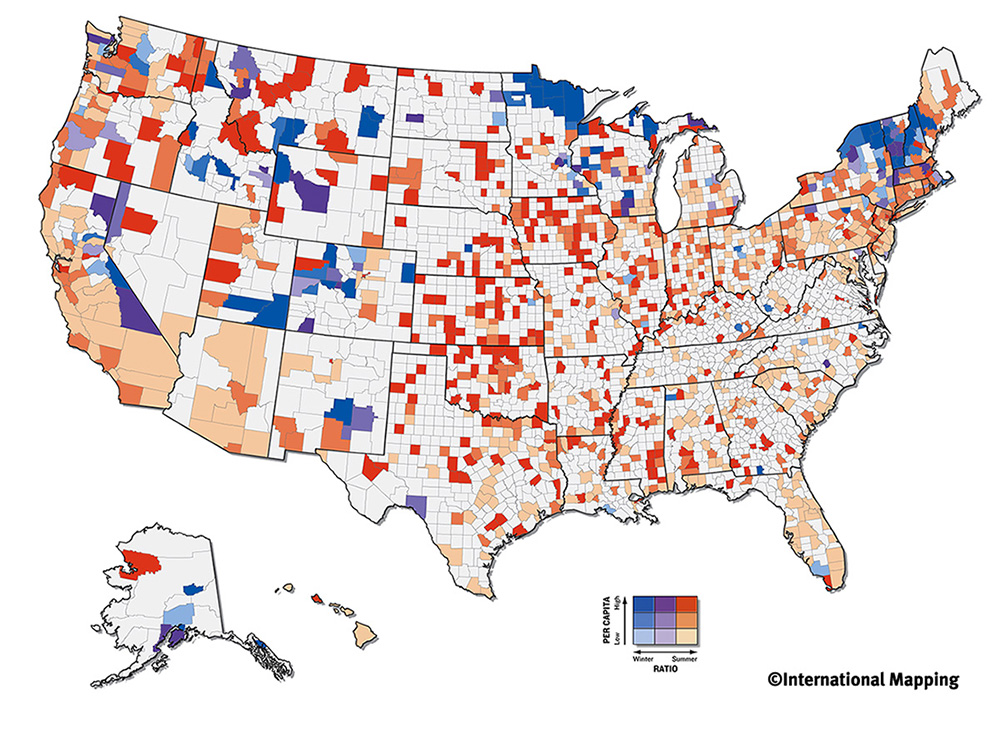
Bivariate choropleth maps display two different variables displayed on one map by including two different sets of graphic symbols or colors. Here is a map depicting olympic athletes. You can see how this type of map can solve spatial problems. http://www.directionsmag.com/images/articles/sportsillustrated/Olympic_Athletes.jpg
Posted by Noles949 at 2:05 PM

No comments:

Post a Comment

Newer Post Older Post Home
Subscribe to: Post Comments (Atom)

Blog Archive

  • ▼  2008 (55)
    • ▼  June (44)
      • Isopachs
      • Remote Sensing
      • Univariate Choropleth Map
      • Unstandardized Choropleth maps
      • Standardized choropleth maps
      • Nominal area choropleth map
      • Bilateral Graph
      • Accumulative line graph or Lorenz curve
      • Index Value Plot
      • Bivariate Choropleth map
      • Unclassed Choropleth Maps
      • Classed Choropleth maps
      • Range Graded Proportional Circle Map
      • Continuously variable proportional circle map
      • Correlation Matrix
      • Scatterplot
      • Population Profile
      • Climograph
      • Windrose
      • Similarity Matrix
      • Stem and Leaf Plot
      • Box Plot
      • Histogram
      • Parallel Coordinate Graph
      • Triangular Plot
      • Star Plot
      • Isopleths
      • Isohyets
      • Isotachs
      • Isobars
      • LIDAR
      • Cartographic Animations
      • Statistical Map
      • Cartograms
      • Flow Map
      • Isoline Maps
      • Proportional Circle Map
      • Dot Distribution Map
      • Propaganda Map
      • Hypsometric map
      • PLSS Map
      • Mental Map
      • Infrared aerial photo
      • Choropleth Map
    • ►  May (11)

About Me

Noles949
View my complete profile