Tuesday, June 24, 2008
Isopachs
http://www.volcano.si.edu/volcanoes/region14/nicarag/cerroneg/14neg13f.png
Here is an isopach map displaying the ash fall from the Cerro Negro Volcano in Nicaragua. Isopach maps are frequently used to assist geologists. They map the areal extent and thickness variation of a stratigraphic unit.
--------------------------------------------------------------------------------
Sunday, June 22, 2008
Remote Sensing
Image URL- http://www.dcs.gla.ac.uk/~hall/personal/files/Glasgow-Satellite.jpg
This image is of Glasgow, Scotland. It is the largest city in Scotland and the third most populated in the United Kingdom. This image depicts many different features of Glasgow, one in particular being the University of Glasgow. This University is well known for contributing to the Scottish Enlightenment. Many other features can be seen such as the River Kelvin.
Univariate Choropleth Map
Unstandardized Choropleth maps
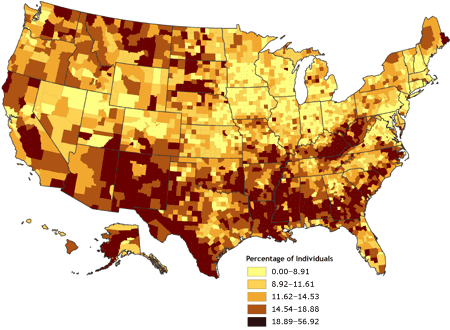
Standardized choropleth maps
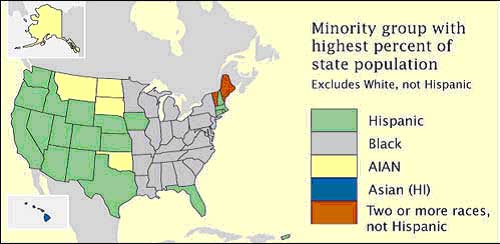
Nominal area choropleth map
Bilateral Graph
http://www.globalhumanitarianassistance.org/New%20Images/Growth%20in%20bilateral%20humanitarian%20assistance%202005-2006%20copy.jpg
A bilateral graph depicts increases on one side of a zero line and a decreases on the other side. Bilateral graphs are used to display data when there is both positive and negative values. Here you can see increases and decreases in humanitarian services in various countries.
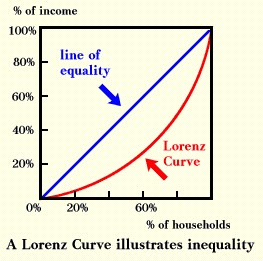
Accumulative line graph or Lorenz curve
Index Value Plot
Tuesday, June 17, 2008
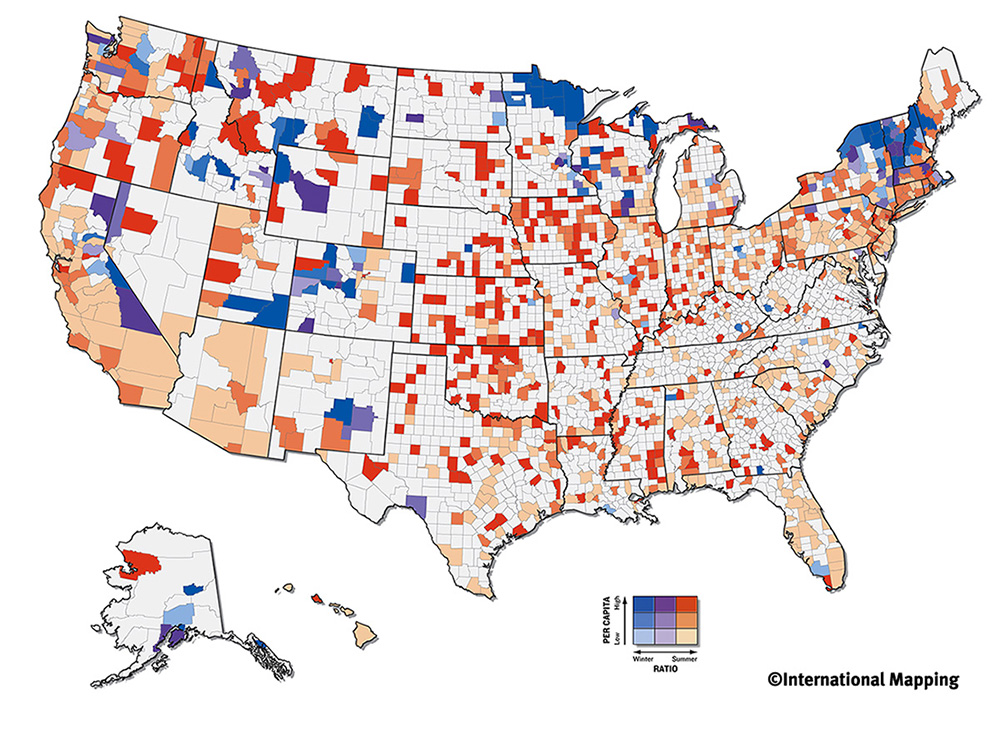
Bivariate Choropleth map
Bivariate choropleth maps display two different variables displayed on one map by including two different sets of graphic symbols or colors. Here is a map depicting olympic athletes. You can see how this type of map can solve spatial problems. http://www.directionsmag.com/images/articles/sportsillustrated/Olympic_Athletes.jpg
Unclassed Choropleth Maps
This technique assigns shadings proportional to the data values so that these choropleth maps do not have to classify the data. This method of mapping has not been generally accepted because many cartographers claim that they lose the ability to direct the message of communication. http://www.agocg.ac.uk/reports/visual/casestud/dykes/figure9.gif
Classed Choropleth maps
A classed choropleth map the main objective is to determine height and shading or color intensity of the bar for each map classed. This would involve creating a classed frequency legend including a frequency histogram, a frequency curve, and shading.
http://www.socialexplorer.com/pub/maps/images/sample-thematic-map.png
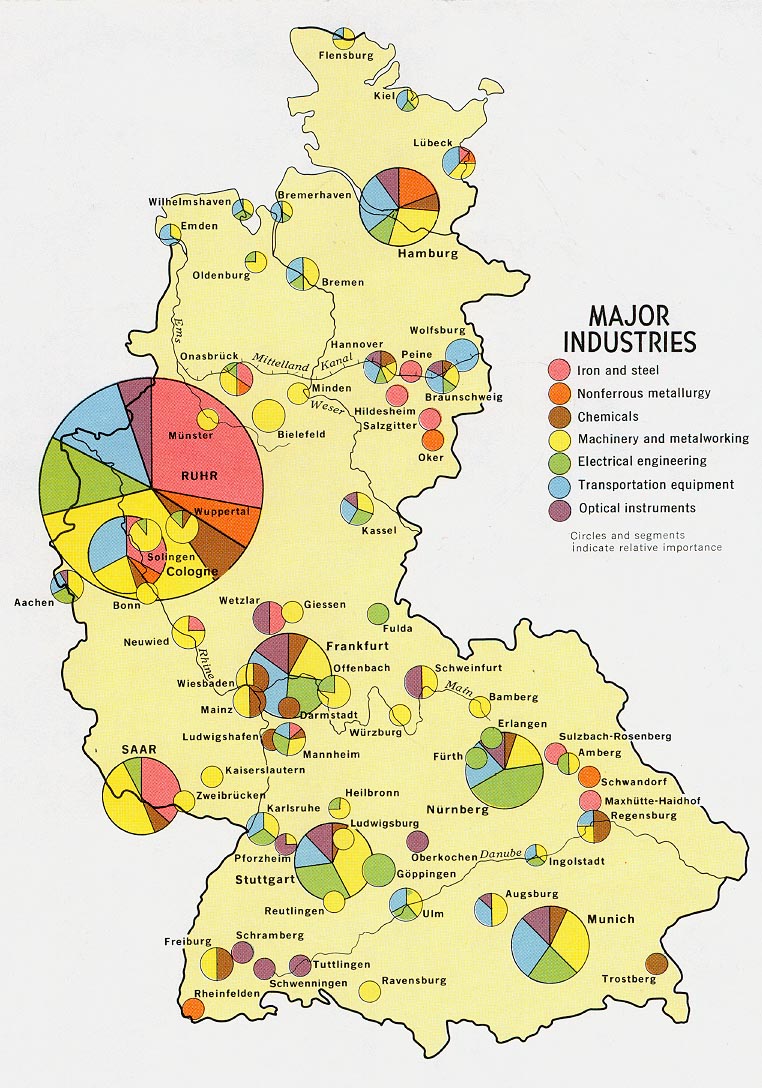
Range Graded Proportional Circle Map
Continuously variable proportional circle map
Correlation Matrix
A correlation matrix lists the variable names down the first column and across the first row. The diagonal of a correlation matrix always consists of ones. In every correlation matrix there are two triangles that are the values below and to the left of the diagonal and above and to the right of the diagonal. A correlation matrix is always a symmetric matrix.
http://www.investors-routemap.co.uk/images/correlation.gif
Scatterplot
A scatterplot uses Cartesian coordinates to display values for two variables froma given set of data. The data is then displayed as a collection of points which each having the value of a variable dermining the position on the horizontal axis and the other variable determining the position on the vertical axis.
http://cnx.org/content/m10949/latest/age_scatterplot.gif
Population Profile
Climograph
Windrose
A wind rose is a graphical tool utilized by meteorologists to depict how wind speed and direction are distributed at a specific location. It will show the frequency of winds blowing from certain directions. Each concentric circle stands for a different frequency which starts at zero in the center and increases in frequency in the outer circles.
http://mensch.org/vplot/windrose/windrose.png
Similarity Matrix
Stem and Leaf Plot
Box Plot
Box plots are very useful to graph groups of numberical data through their five number summaries. It was invented in 1977 by John Tukey who was an American. They are also used to depict differences in populations without making assumptions on statistical distribution.
http://support.sas.com/rnd/base/topics/statgraph/proctemplate/images/boxplot.gif
Histogram
histogram is a graphical display of tabulated frequencies. It shows what proportion of cases fall into each of several categories. There is a difference between a histogram and a bar chart in the sense that it is the area of the bar that dictates the value, not the height, which is a very important difference particularly when the variables are not all the same width.
http://www.daisy2000.com/Daisy2003/HorizontalHistogram.gif
Parallel Coordinate Graph
Triangular Plot
Star Plot
Isopleths
An isopleth map generalizes and simplifies data with a continuous distribution. It shows the data as a third dimension on a map. They are mostly used for mapping surface elevations, amounts of precipitation, atmospheric pressure, and other measurements that can be viewed statistically as a third dimension.
http://hawaiimold.com/wp-content/uploads/2008/01/germination-isopleth.jpg
Isohyets
Isotachs
Isobars
LIDAR
LIDAR (Light Detection and Ranging) is an optical remote sensing technologay that measures different properties of dispersed light to find range or other information of a distant target. The difference between lidar and radar is that lidar uses shorter wavelenths of the electromagnetic spectrum, generally close to infrared.
Here is a LIDAR image of lower manhattan.
http://www.noaanews.noaa.gov/stories/images/manhattan-lidar092701.jpg
Wednesday, June 4, 2008
Cartographic Animations
Cartographic animation has become a useful technique for representing geographical area's because of its capablilites to show relations between geospatial data's components, location, attribute, and time. They are typically used to display geospacial information. The goal of cartographic animation is to be able to visualize somethign that would not be seen if the maps were looked at individually.
Statistical Map
Statistical maps are used to display the distribution of a certain variable over a geographic area. In these maps each unit is represented by a shading technique or color that represents a value. The statistics shown on the map are expressed as rates, ratios, percentages, or other statistical measures.
Cartograms
A cartogram is a map where area is not presevered. Many times they are used to represent the size of populations relative to the area in which they inhabit. There are two main types of cartograms: area and distance cartograms.
http://www.math.yorku.ca/SCS/Gallery/images/cartogram/statecartredblue.png
Flow Map
Isoline Maps
http://www.lib.utexas.edu/maps/atlas_mexico/mean_annual_precipitaion.jpg
Isoline maps are a two dimensional representation of a three dimensional model. An isoline map give you a picture of the concentration of people.
Proportional Circle Map
Tuesday, June 3, 2008
Dot Distribution Map
Dot Distribution Maps are useful to help show populations. Here shows the population of military families and where they live in relation to the state. You can see that military families live in every county in the state. http://operationmilitarykids.ohio4h.org/resources/images/dotMap.gif
Propaganda Map
Hypsometric map
PLSS Map
PLSS (Public Land Survey System) maps are used to divide up public lands which are owned by the Federal Government. These are created to help the citizens of the United States. Since these surveys were completed many changes have occured in regards to public lands being now privately owned and vice versa.
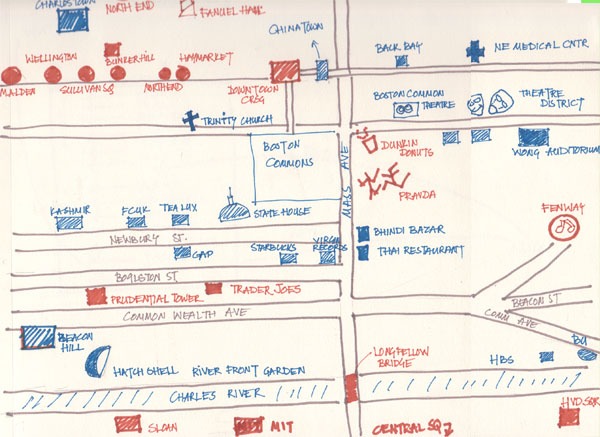
Mental Map
http://ocw.mit.edu/ans7870/MAS/MAS.965/f04/assignments/tripti/Assignment10/MyMap.jpg
Mental maps refer to a person's point of view. They can be used to show a person's views regarding the size of their country in comparison with another country. These maps are subject to the opinions of the cartographer that is constructing the graph.
Infrared aerial photo
Choropleth Map
Choropleth Maps thematic map with areas shaded in reference to the statisitc that is being measured. Here is a map of Florida with areas shaded in regards to percentage of Hispanic population by percentage. As you can see, South Florida has a larger proportion of Hispanics compared to the rest of the state.
Subscribe to:
Posts (Atom)