Sunday, May 25, 2008
Cadastral Map
http://www.ncdot.org/doh/PRECONSTRUCT/highway/photo/Products/images/Planimetric_map.jpg
Cadastral maps deal with displaying a precise description of particular pieces of land. Generally names or numbers are assigned to each pand parcel which help identify the property. With these types of maps, the scale is crucial so accurate identification of the land is given.
Thematic Map
DOQQ
www.utexas.edu/.../blue_Travis_doqq.jpg
Here is a DOQQ(digital orthophoto quadrangle) map of Lake Travis conducted by the University of Texas at Austin, Texas. This was part of an attempt to help create a better floodplain map for Lake Travis and the surrounding area. A DOQQ map is a computer generated image of an aerial photo with geometric qualities of a map.
DRG
www.forestpal.com/images/drg.gif
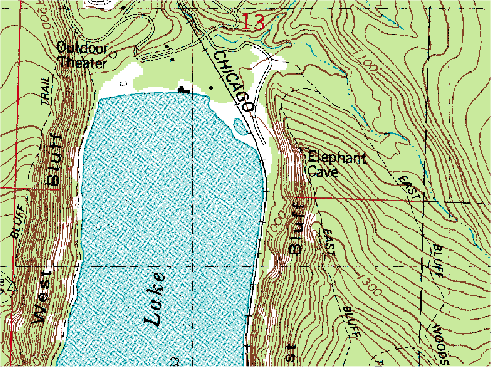
DRG maps are digital raster graphics. They are scanned images of a U.S. Geological Survey standard series topographic map. The image inside the map neatline is georeferenced to the surface of the earth and fit to the Universal Transverse Mercator projection. The map is scanned at a minimum resolution of 250 dots per inch.
DLG
DEM
Saturday, May 24, 2008
Planimetric Map
http://www.ncdot.org/doh/PRECONSTRUCT/highway/photo/Products/images/Planimetric_map.jpg
Planimetric maps display the horizontal position of planimetric features utilizing lines and symbols. They also use an X,Y coordinate system to help the person reading the map. They are great at accurately giving horizontal distances.
Black and White Aerial Photo
Here is a black and white aerial photo of Wrigley Field. This photo was taken by an airplane flying over the field. This field was built in 1914 and is one of the oldest fields in major league baseball. Black and white aerial photos give people a unique perspective at an area.
http://www.horschgallery.com/admin/uploads/Products/Product326/bw29-black-white-wrigley-field-aerial-picture-photo-print-framed.jpg
Wednesday, May 21, 2008
Doppler
A Doppler Radar uses the Doppler effect of returned echoes from certain objects to measure their radial velocity. They are used for various things including air traffic control, police speed guns, and air defense. Here is a photograph from a Doppler Radar of Hurricane Andrew that hit Miami and caused extreme damage.
Mercator Projection
www.geography.org.uk/.../GA_REMapMercator.jpg
Gerardus Mercator developed this map in 1567. This was an excellent map for the sixteenth century and was used by sailors for navigation. The further lines of longitude remain parallel while the lines of latitude widen in distance as you move further from the equator. This causes the land masses in the poles to be exaggerated in size.
Saturday, May 17, 2008
Subscribe to:
Posts (Atom)